


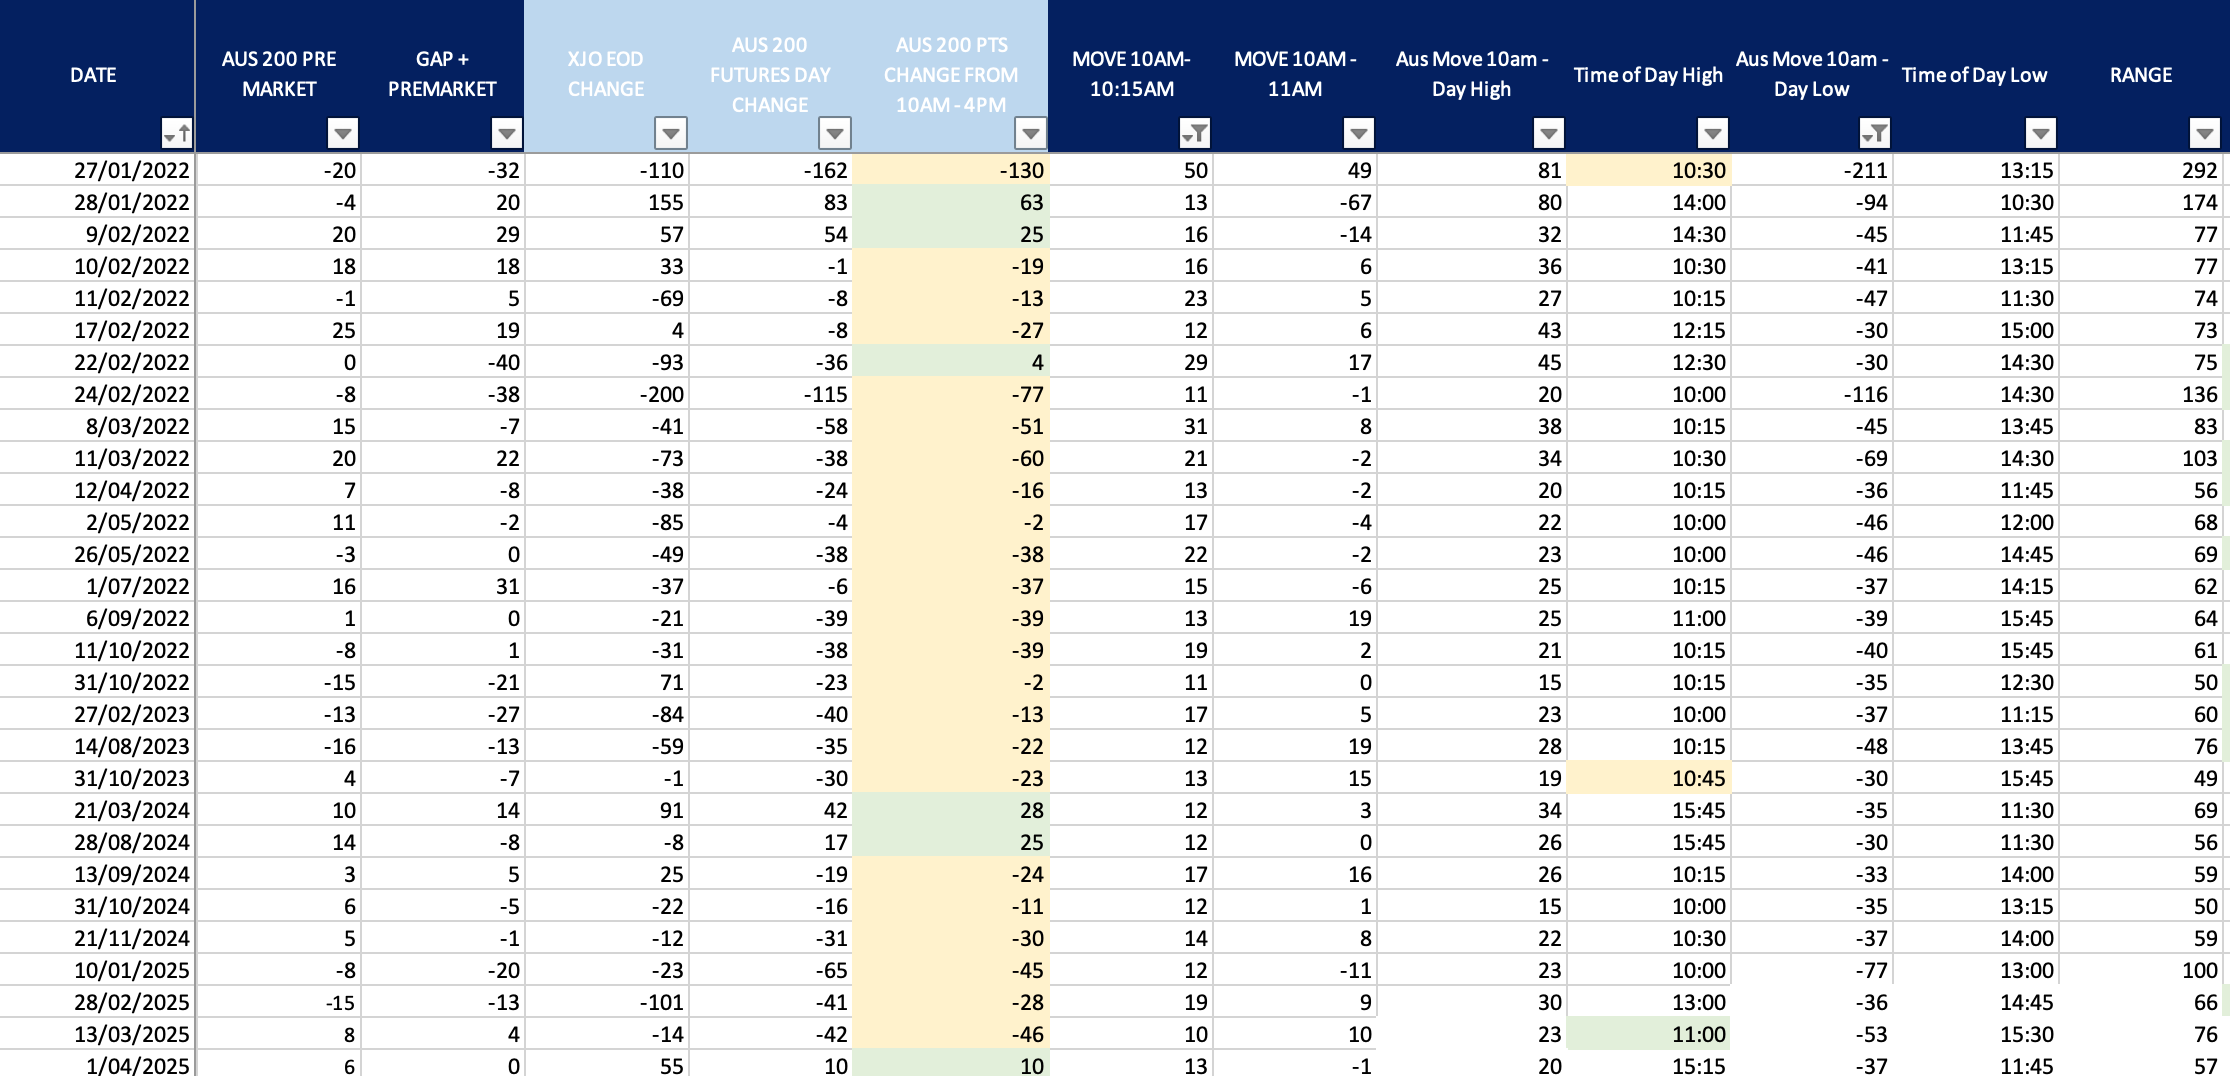
Performance Metrics - AUS200 Early Rally then Fall
Below are common metrics over these 28 trading days:
Total Return:
+102.4% (on the $10,000 account)Win Rate (number of positive‐PnL days ÷ total days):
Positive days: 18
Negative days: 9
Break‐even days: 1
Win Rate = 18/28 ≈ 64.3%
Maximum Drawdown
Worst peak‐to‐trough drop in equity was $1,550 below the then‐highest equity.
That amounted to about 8.1% off the peak (when equity had risen above $19k).
Average Daily P&L
$10,240 total ÷ 28 trades ≈ $365.71 per day.Largest Single‐Day Gain
+$8,610 (on 28/01/2022)
Largest Single‐Day Loss
-$1,900 (on 27/01/2022)
Profit Factor
Sum of all winning days = $14,170
Sum of all losing days = $3,930 (absolute value)
Profit Factor = 14,170 ÷ 3,930 ≈ 3.61
Approx. Sharpe Ratio (using sample stdev of daily PnL)
Mean daily PnL ≈ $365.71
Std. dev. of daily PnL ≈ $1,705
Sharpe = 365.71 / 1705 ≈ 0.21
The purpose of producing these videos is to provide subscribers with reference points and trade ideas based on unique market insights pulled from the TGM Dataset. Please Do Your Own Research and trade according to your own personal risk tolerance and financial position.

Share this post